Quick Grafana variable template tips
Published: Sun Jun 25 2023
Mostly for my sake (as documentation of sorts), I decided to post two quick variable templating Grafana tips today.
Query result template variable from Prometheus
If we try to use a query result type in Grafana from Prometheus metrics, by default, we end up with a value field that looks something like this:
# Query
delta(timestamp(vector(1))[$__range:]) / 3600
# Result
{} 24 1687718708000
This basically returns:
- Labels
- Query result value
- Timestamp of the query
If we wanted to use the value later, this would hardly be useful.
Grafana, however, offers us to extract the value that we are looking for using Regex, based on Google’s RE2.
# Query
delta(timestamp(vector(1))[$__range:]) / 3600
# Regex
/.* ([^ ]*) .*/
# Result
24
Using that yields us a simple result in the value:
24Getting the number of hours in a selected time range
What would this be useful for?
Let’s say that for every hour, we are fetching GCP projects costs for a particular project:
# Query:
sum(gcp_project_cost{project="Kubernetes"}) by (environment)
Visualization:
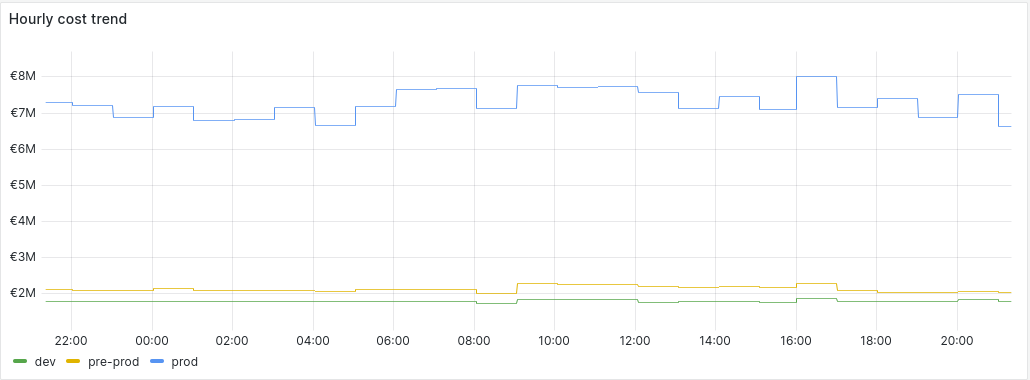
This is already some useful information, but the next question we probably have is how much money do we spend in total for a selected time period. Here our magic query comes in:
# Grafana template variable called RANGE_HOURS_COUNT query:
delta(timestamp(vector(1))[$__range:]) / 3600
# The actual query:
avg(avg_over_time(gcp_project_cost{project="Kubernetes"}[$__range])) by (environment) * $RANGE_HOURS_COUNT
“Wait, isn’t this the same query from the first example?”
Yeah, it is. :) And it’s exactly this query that gets us the number of hours in any selected time range.
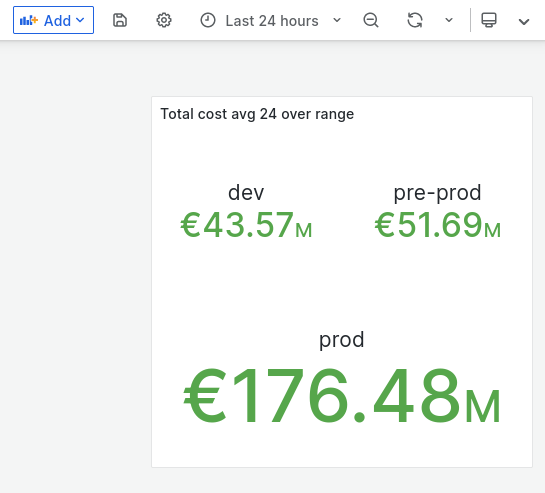
Anyway… here come the results
Visualization (24 hours):
Visualization (12 hours):
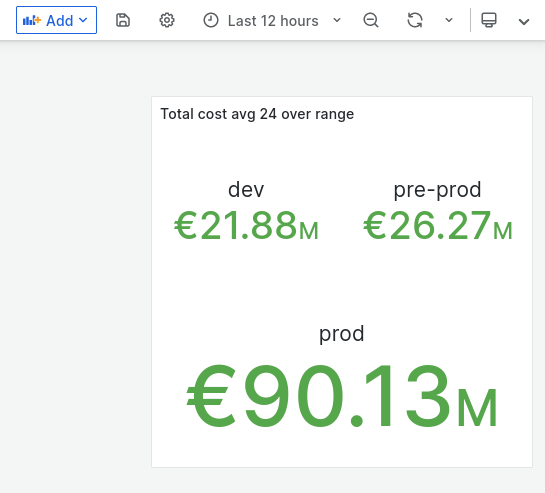
And there we have it!
We can also clearly see that the last 12 hours were slightly more expensive than the previous 12 hours - but let’s keep that discussion for another day.
Thanks for reading and until next time!
P.S.
The actual cost data above has been tampered with by multiplying the original data with a random number to keep the original data private.
I sure hope your Kubernetes clusters don’t cost this much money for the selected time periods.